
News
Prevalence of radon in Canada
06
May
May
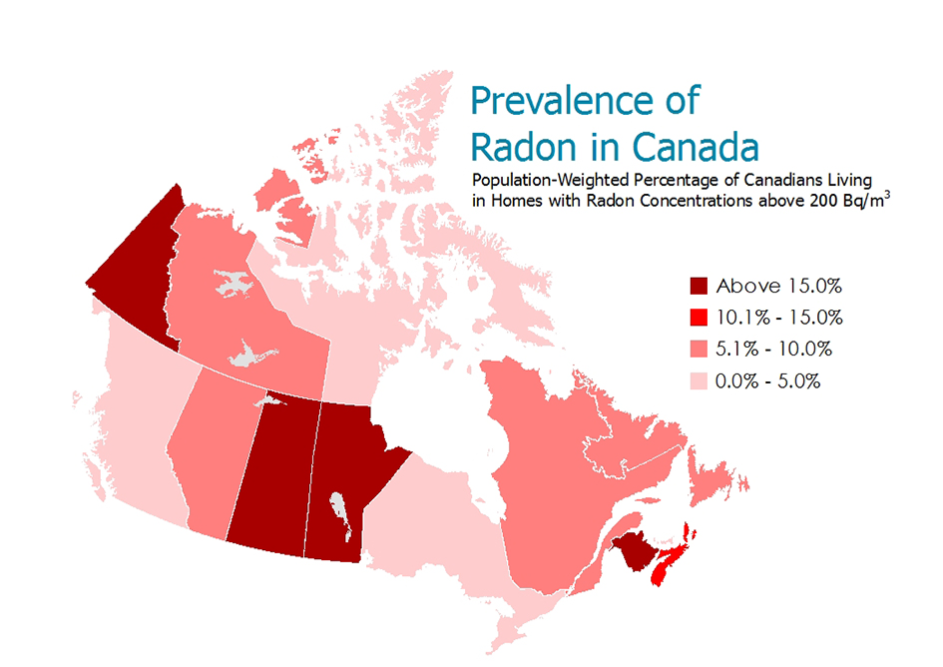
The map depicts the prevalence of radon in Canada, by province and territory, in terms of population-weighted percentages of Canadians living in homes with radon concentrations above 200 Bq/m3. There are four ranges represented: “0.0% to 5.0%”, “5.1% to 10.0%”, “10.1% to 15.0%”, and “above 15.0%”.
| Province or territory | Canadians living in homes with radon concentrations above 200 Bq/m3 |
|---|---|
| percent | |
| Newfoundland and Labrador | 5.1 to 10.0 |
| Prince Edward Island | 0.0 to 5.0 |
| Nova Scotia | 10.1 to 15.0 |
| New Brunswick | Above 15.0 |
| Quebec | 5.1 to 10.0 |
| Ontario | 0.0 to 5.0 |
| Manitoba | Above 15.0 |
| Saskatchewan | Above 15.0 |
| Alberta | 5.1 to 10.0 |
| British Columbia | 0.0 to 5.0 |
| Yukon | Above 15.0 |
| Northwest Territories | 5.1 to 10.0 |
| Nunavut | 0.0 to 5.0 |